


Share of Model is becoming the headline metric of AI visibility, and it is being measured badly. Vendors compute it differently, definitions shift between decks, and single screenshots of a ChatGPT answer are presented as evidence of presence or absence. This article does two things: it states a clean definition, and it sets out a measurement protocol that anyone, client, competitor or sceptic, can reproduce without our tooling. Transparency about method is the only thing that makes a metric trustworthy, and we would rather you check our numbers than take them on faith.
What is Share of Model?
Share of Model is the percentage of AI generated answers, across a defined prompt set, a defined set of models and a defined time window, in which your brand appears. It is analogous to share of voice in media measurement: not a rank, but a rate of presence in the conversations that matter to you. A rigorous version always names its three parameters, because a Share of Model figure without a prompt set, a model list and a date range is not a measurement, it is an anecdote.
Expressed as a formula: Share of Model equals the number of answers mentioning the brand, divided by the total number of answers generated, multiplied by one hundred. The refinements that follow, recommendation weighting, position weighting, sentiment, are useful, but they are refinements. Get the base rate right first.
Why a single screenshot proves nothing
Large language models are probabilistic. Ask the same model the same question twice and you will often receive different answers, with different brands in them. On top of that variance sits volatility in the retrieval layer: Semrush’s tracking recorded ChatGPT citing Reddit in close to sixty per cent of responses in August 2025 and around ten per cent six weeks later, an enormous shift in the underlying source pool in under two months. A metric read from one run, on one day, on one model, captures noise and presents it as signal.
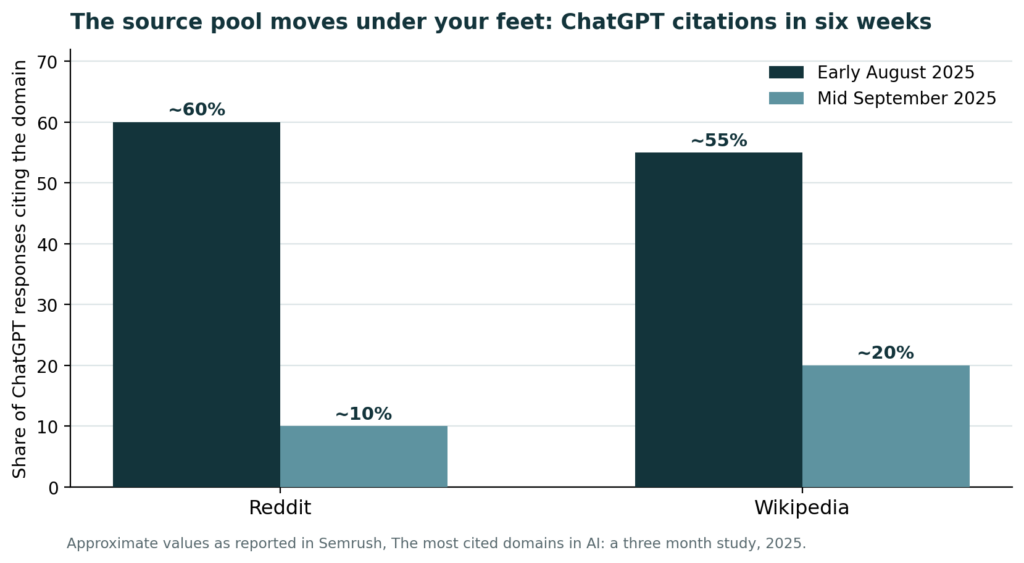
Source: SEMrush. Share of ChatGPT responses citing each domain, six weeks apart. Approximate values as reported in Semrush’s three month study of the most cited domains in AI, 2025.
The protocol
Step one: construct the prompt set
Write twenty to fifty prompts that reflect how real buyers ask. Cover three intent types: category discovery (best platforms for X), comparison (X versus Y for mid market teams) and problem framing (we struggle with X, what should we use). Phrase them the way people speak, not the way keyword tools suggest; analyses of user behaviour consistently show AI prompts running far longer than search queries, with HubSpot’s research putting the average ChatGPT prompt at around twenty three words against three to four for a Google search. Freeze the set. Every future measurement uses the same prompts, or the trend line means nothing.
Step two: choose the models and surfaces
Measure at minimum across ChatGPT, Perplexity, Gemini and Google’s AI Overviews, and add Claude if your category skews professional. The engines draw on visibly different source pools; published citation analyses find only a small minority of domains cited by both ChatGPT and Perplexity. A brand can hold a strong position in one engine and be absent from another, so a single engine number is not a Share of Model, it is a share of that model.
Step three: decide the number of runs
Run each prompt multiple times per engine, in fresh sessions. We use ten runs per prompt per engine as a working floor, thirty where budgets allow. The correct number is the one at which your figure stabilises: if five additional runs move the result by more than a couple of percentage points, you have not yet measured it. Record everything, raw answers included, at collection time.
Step four: classify with written rules
Before reading a single answer, write down what counts. We distinguish three levels. A mention: the brand appears in the answer text. A recommendation: the brand is offered as a suggested choice for the asked question. A citation: the brand’s own domain is linked as a source. These are different assets; published platform analyses find brands are frequently mentioned by ChatGPT without any link, while the citation often goes to a third party review site or forum thread discussing the brand. Decide in advance how hedged answers, refusals and follow up clarifications are scored, and apply the rules mechanically.
Step five: score and weight
Report the simple presence rate first, then the recommendation rate as the stricter and more commercially honest figure. If you weight by position in the answer, say so and publish the weights; the precedent here is the Princeton GEO benchmark, which introduced position adjusted metrics for exactly this reason. Report each engine separately as well as the blended figure, because the blend hides the differences that tell you where to act.
Step six: report like a researcher, not a salesperson
Publish the prompt set, the run counts, the dates and the classification rules alongside the numbers. Show the range across runs, not just the mean. Repeat the measurement on a fixed cadence, monthly is realistic, and report movement only when it exceeds the noise you have already documented. A ten point swing means nothing if your own variance chart shows twelve point swings between Tuesdays.
What published measurements already show
The protocol matters because the engines genuinely behave differently, and the published data proves it. OtterlyAI’s analysis of over one million citations collected in January and February 2026 found the share of citations pointing to brand owned domains varies sharply by platform, with community sites such as Reddit and Quora taking a slightly larger share than brands overall.
| Platform | Citations to brand owned domains |
| Google AI Overviews | 59.8% |
| ChatGPT | 44.7% |
| Perplexity | 28.9% |
Source: OtterlyAI, analysis of one million plus AI citations, January to February 2026.
A brand can look healthy in Google AI Overviews, where domain authority still carries weight, while remaining invisible in Perplexity, where the citation pool runs through community discussion. A blended average would hide exactly the difference that tells you where to act, which is why the protocol insists on reporting each engine separately.
What this metric cannot tell you
Share of Model measures presence, not persuasion. It does not tell you whether the mention was accurate, favourable or current, which is why we pair it with sentiment sampling. It is also corrupted easily: personalisation and memory features mean a logged in account that has discussed your brand before will inflate your numbers, so collection must use clean sessions. Geography and language matter too, since answers differ across regions and an English only measurement says nothing about your visibility in Spanish or German. Name these limits in every report. A metric whose weaknesses are documented is worth more than one that claims none.
By André Franco, Senior SEO/GEO consultant at Textbroker


